Career Counselling 2.0 HomeHomeCareer Counselling 2.0 AbroadAbroadCareer Counselling 2.0 PlanPlanCareer Counselling 2.0 | TalksTalksCareer Counselling 2.0 PhilosophyPhilosophyCareer Counselling 2.0 SeminarSeminarCareer Counselling 2.0 PagesPagesCareer Counselling 2.0 AdvisorsAdvisorsCareer Counselling 2.0 TestimonialsTestimonials

Data Analysis

Senior Associate Sunaina Kuhn talks about Data Analysis course, what is Data Analysis and other details about a Career in Data Analysis.


Data Analysis

Sunaina Kuhn | Senior Associate | Evaldesign


What is Data Analysis?


You may be curious about a Career in Data Analysis. Internet is brimming with pages on How to get into Data Analysis, while one should first understand What is a Career in Data Analysis. The most authoritative source of information on Data Analysis is someone with real experience in it.

Senior Associate Sunaina Kuhn invested 3 years & 4 months in Data Analysis. Senior Associate Sunaina Kuhn outlines Data Analysis as:

Data analysis, also known as analysis of data or data analytics, is a process of inspecting, cleansing, transforming, and modeling data with the goal of discovering useful information, suggesting conclusions, and supporting decision-making.


How Senior Associate Sunaina Kuhn got into Data Analysis?


After completing my Schooling from Woodstock, I did BA in Political Science from Purdue University. I taught Business English for a year in Budapest. After that I joined Teach for India. I also worked as a Research Associate in IIM, Ahmedabad. I have been working as a Senior Associate at Evaldesign since 2015.


Senior Associate Sunaina Kuhn's Talk on Data Analysis


Session Image
The Journey of Data Analysis


What Is Data Analysis

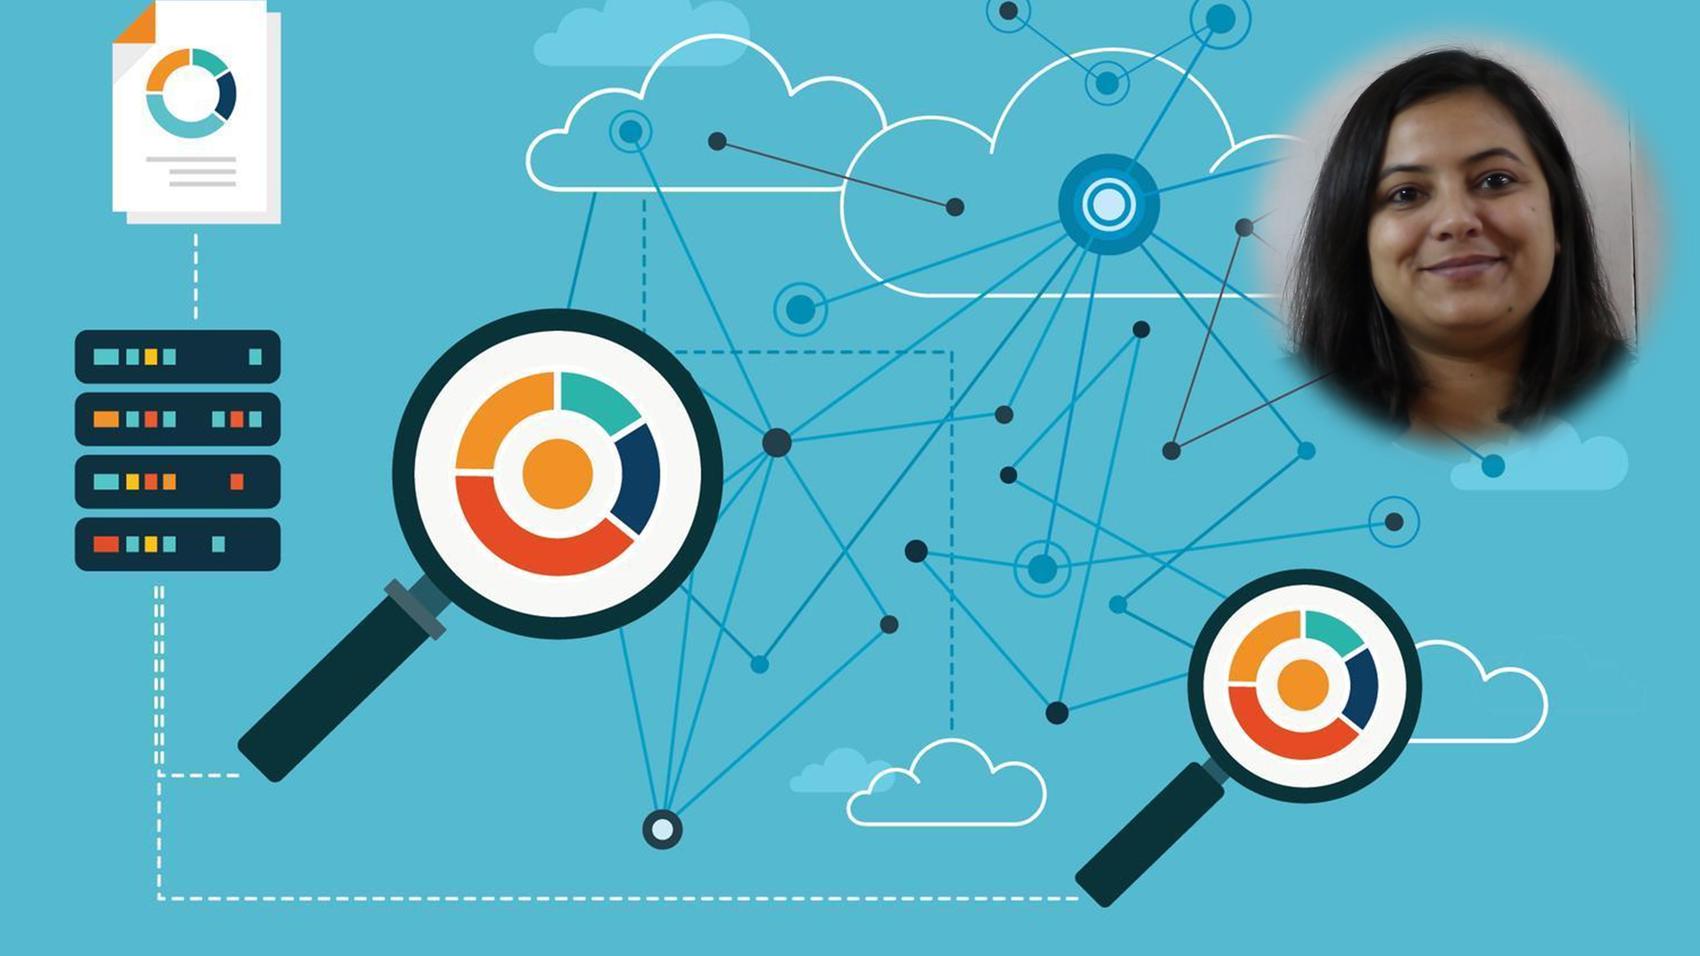
Data Analysis

### Data Analysis Image
What is
Data analysis is the systematic process of inspecting, cleaning, transforming, and modeling data to discover useful information, draw conclusions, and support decision-making. It involves applying statistical and logical techniques to interpret complex datasets, enabling organizations to identify patterns, trends, and relationships that inform business strategies.

Concept
Data analysis plays a crucial role in today’s data-driven world, enabling organizations to make informed decisions and gain a competitive edge. For professionals in data analysis, it provides the tools to turn raw data into actionable insights, directly influencing business outcomes. One major benefit is improved decision-making, as data-driven insights reduce guesswork and uncertainty. Another benefit is increased efficiency, as data analysis helps identify bottlenecks and optimize processes. Additionally, it fosters innovation by uncovering hidden opportunities and trends, allowing organizations to adapt quickly to changing markets. Overall, data analysis empowers professionals to add significant value to their organizations and drive continuous improvement.

Real World Example
A data analyst working for an e-commerce company might be tasked with understanding customer purchasing behavior. By collecting and analyzing sales data, website interactions, and customer demographics, the analyst can identify which products are most popular among different customer segments. This analysis might reveal that certain products sell better during specific seasons or that customers from particular regions prefer different items. Using these insights, the company can tailor its marketing campaigns, optimize inventory management, and personalize recommendations for shoppers. As a result, the business can increase sales, reduce costs, and enhance customer satisfaction, all driven by the insights uncovered through effective data analysis.

Education


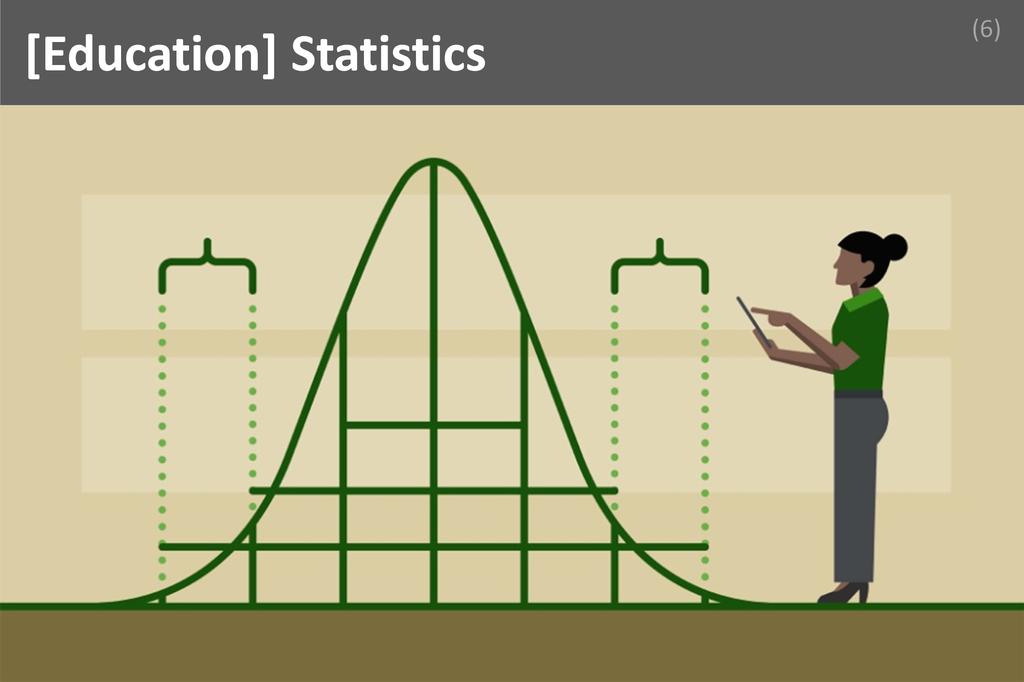
Statistics

### Statistics Image
What is
Statistics is the science of collecting, organizing, analyzing, interpreting, and presenting data. It provides methods for making sense of complex information and drawing meaningful conclusions. In data analysis, statistics is essential, forming the backbone of both academic study and professional practice by enabling informed decision-making and evidence-based insights.

Concept
A solid grasp of statistics is indispensable for anyone pursuing a career in data analysis. Understanding statistical concepts allows professionals to accurately interpret data, identify patterns, and avoid common pitfalls such as misleading averages or spurious correlations. Mastery of statistics empowers analysts to design robust experiments, validate hypotheses, and communicate findings with confidence. This foundational knowledge not only enhances technical proficiency but also fosters critical thinking and problem-solving skills. Over the long term, expertise in statistics opens doors to advanced analytical roles, supports continuous learning in emerging fields like machine learning, and ensures adaptability in a rapidly evolving data-driven landscape. Ultimately, statistics is the language through which data analysts translate raw numbers into actionable business intelligence.

Real World Example
Imagine a data analyst working for a retail company tasked with understanding customer purchasing behavior. By applying statistical techniques such as regression analysis, the analyst can determine which factors most influence sales, such as seasonality, promotions, or customer demographics. Using hypothesis testing, they can assess whether a recent marketing campaign significantly increased sales or if observed changes are due to random variation. The analyst’s ability to interpret confidence intervals and p-values ensures that recommendations to management are based on sound evidence rather than guesswork. In this daily workflow, theoretical knowledge of statistics directly informs practical decisions, driving business strategy and optimizing outcomes.

Programming Languages

### Programming Languages Image
What is
Programming languages are formal systems of communication used to instruct computers to perform specific tasks. They consist of syntax and semantics that enable humans to write algorithms and process data efficiently. In data analysis, programming languages are essential tools for manipulating, analyzing, and visualizing data, forming a core competency in the field.

Concept
Understanding programming languages is crucial for anyone pursuing a career in data analysis because they provide the means to automate repetitive tasks, handle large datasets, and implement complex analytical techniques. Mastery of languages such as Python or R allows professionals to efficiently clean, transform, and interpret data, which is fundamental to extracting actionable insights. This foundational knowledge not only enhances problem-solving abilities but also increases adaptability to new tools and technologies as the field evolves. Over the long term, proficiency in programming languages opens doors to advanced roles, supports collaboration with technical teams, and ensures competitiveness in a rapidly changing job market.

Real World Example
Consider a data analyst working for a retail company who needs to identify purchasing trends from millions of transaction records. By leveraging their knowledge of programming languages, the analyst writes scripts to automate data cleaning, merges multiple datasets, and applies statistical models to uncover patterns. This process, which would be nearly impossible to execute manually, becomes efficient and reproducible thanks to programming. The analyst can then visualize the results, generate reports, and share findings with stakeholders, all while ensuring accuracy and scalability. This daily application of programming languages transforms raw data into valuable business intelligence, directly impacting strategic decision-making within the organization.

Industry Knowledge

### Industry Knowledge Image
What is
Industry Knowledge refers to a comprehensive understanding of the specific trends, regulations, challenges, and operational practices within a particular sector. For data analysts, it bridges the gap between technical expertise and real-world application, enabling them to interpret data within the correct context and make informed, impactful decisions that align with industry standards.

Concept
Developing strong industry knowledge is essential for data analysts because it transforms raw data into actionable insights that are meaningful within a specific business environment. Without this context, even the most advanced analytical techniques can lead to misinterpretation or irrelevant conclusions. Industry knowledge allows professionals to identify which metrics truly matter, anticipate market shifts, and communicate findings in a way that resonates with stakeholders. Over time, this expertise not only enhances the accuracy and relevance of analyses but also positions data analysts as trusted advisors who can drive strategic decisions. Mastery of industry-specific nuances fosters career growth, opens doors to leadership roles, and ensures long-term professional adaptability in a rapidly evolving job market.

Real World Example
Consider a data analyst working in the healthcare sector who is tasked with evaluating patient readmission rates. Their industry knowledge informs them about regulatory requirements, such as those set by government health agencies, and the financial implications of high readmission rates for hospitals. By understanding these factors, the analyst can design more effective data models, select the right variables, and interpret results in a way that highlights compliance risks and cost-saving opportunities. This contextual awareness enables them to recommend targeted interventions, such as improved discharge planning or patient education programs, that directly address industry-specific challenges. As a result, their analyses not only provide statistical insights but also drive meaningful improvements in patient care and organizational performance.

Skills


Critical Thinking & Creativity

### Critical Thinking & Creativity Image
What is
Critical Thinking & Creativity is the ability to objectively analyze information, question assumptions, and generate innovative solutions by connecting disparate ideas. In data analysis, this skill empowers professionals to interpret complex datasets, identify meaningful patterns, and devise novel approaches to problem-solving, making it indispensable for impactful and accurate insights.

Concept
Critical Thinking & Creativity enhances a data analyst’s performance by enabling them to approach problems from multiple perspectives, challenge conventional interpretations, and uncover hidden trends within data. Employers and clients highly value this skill because it leads to more robust analyses, actionable recommendations, and the agility to adapt to evolving business needs. Cultivating this ability involves regularly questioning data sources, seeking alternative explanations, and engaging in brainstorming sessions with peers. Over time, exposure to diverse datasets and real-world challenges further sharpens one’s analytical and creative faculties, ensuring that solutions are both innovative and grounded in evidence.

Real World Example
Imagine a data analyst tasked with identifying the cause of a sudden drop in customer engagement for an online platform. Rather than accepting surface-level explanations, the analyst employs critical thinking to scrutinize user behavior data, marketing campaigns, and external factors. By creatively integrating social media sentiment analysis with traditional metrics, the analyst uncovers that a recent platform update unintentionally alienated a key user segment. This insight, achieved through a blend of analytical rigor and creative problem-solving, enables the company to swiftly address the issue, restore engagement, and prevent future missteps, demonstrating the tangible value of critical thinking and creativity in data analysis.

Passion

### Passion Image
What is
Passion is an intense enthusiasm and commitment toward a subject or activity, driving individuals to pursue excellence, overcome challenges, and continuously seek improvement. In data analysis, passion fuels curiosity and perseverance, enabling professionals to dig deeper into datasets, uncover meaningful insights, and remain motivated through complex, often tedious analytical tasks.

Concept
Passion directly enhances a data analyst’s performance by fostering a genuine interest in exploring data, learning new tools, and staying updated with industry trends. Clients and employers highly value passionate analysts because their intrinsic motivation leads to higher quality work, innovative solutions, and a proactive approach to problem-solving. Passionate professionals are more likely to go beyond basic requirements, ensuring that analyses are thorough and actionable. Cultivating passion involves engaging with diverse datasets, participating in data communities, and continuously challenging oneself with new projects. Over time, this dedication transforms routine tasks into opportunities for growth and discovery, making passion an indispensable asset in a data analyst’s career.

Real World Example
Imagine a data analyst working for a healthcare organization who is tasked with identifying patterns in patient readmission rates. The initial analysis reveals no clear trends, and the project stalls. However, driven by passion, the analyst delves deeper, experimenting with different data segmentation techniques and consulting recent research. This enthusiasm leads to the discovery of subtle correlations between medication adherence and readmission rates. The analyst’s passion not only uncovers actionable insights but also inspires the team to implement new patient follow-up protocols, ultimately reducing readmissions and improving patient care. In this scenario, passion transforms a challenging assignment into a breakthrough success, demonstrating its critical role in achieving impactful outcomes.

Patience

### Patience Image
What is
Patience is the ability to remain calm, composed, and persistent when faced with delays, challenges, or repetitive tasks, without becoming frustrated or giving up. In data analysis, patience is crucial because extracting meaningful insights often requires meticulous attention, repeated testing, and the willingness to revisit and refine approaches until reliable results emerge.

Concept
Patience directly enhances a data analyst’s performance by allowing them to thoroughly clean, explore, and interpret complex datasets without rushing to conclusions. Employers and clients value this quality because it leads to more accurate, reliable, and actionable insights, reducing the risk of costly errors. Cultivating patience involves embracing a growth mindset, practicing mindfulness, and setting realistic expectations for the iterative nature of data work. Over time, analysts who consciously slow down and focus on the process develop resilience and a deeper understanding of their data, which ultimately leads to more thoughtful and impactful analyses. By viewing setbacks as opportunities to learn rather than obstacles, professionals can steadily build this essential skill.

Real World Example
Imagine a data analyst tasked with identifying the root cause of a sudden drop in sales for a major client. The initial data appears inconsistent, with missing values and conflicting trends. Instead of rushing to present a quick answer, the analyst patiently investigates, meticulously cleaning the data, validating sources, and running multiple analyses. This careful, persistent approach uncovers a subtle error in the data collection process that had gone unnoticed. By exercising patience, the analyst not only solves the immediate problem but also helps the client implement better data practices, ultimately leading to more reliable business decisions and long-term trust in the analyst’s expertise.

Adaptability

### Adaptability Image
What is
Adaptability is the ability to adjust quickly and effectively to new conditions, challenges, or environments. In data analysis, adaptability means being open to evolving technologies, shifting project requirements, and unexpected data patterns. It enables professionals to respond constructively to change, ensuring their insights remain relevant and valuable in dynamic business landscapes.

Concept
Adaptability directly enhances a data analyst’s performance by allowing them to pivot strategies when faced with new data sources, evolving business questions, or emerging analytical tools. Employers and clients highly value this skill because the field of data analysis is constantly changing, with frequent updates in software, methodologies, and industry standards. Analysts who demonstrate adaptability can seamlessly integrate new techniques, troubleshoot unforeseen issues, and deliver actionable insights even when initial plans are disrupted. Cultivating adaptability involves embracing continuous learning, seeking feedback, and practicing flexibility in daily tasks. Over time, analysts who proactively expose themselves to diverse projects and technologies build resilience, making them indispensable assets to any organization.

Real World Example
Imagine a data analyst working on a marketing campaign’s performance report when the client suddenly requests an analysis of a new social media platform that was not part of the original scope. The analyst, demonstrating adaptability, quickly researches the platform’s data export options, learns its unique metrics, and integrates this new data source into the existing analysis. Despite tight deadlines and unfamiliar territory, the analyst delivers a comprehensive report that addresses the client’s updated needs. By adapting to the unexpected change, the analyst not only meets the client’s expectations but also strengthens their reputation as a reliable and resourceful professional, ultimately contributing to the project’s overall success.

Problem Solving

### Problem Solving Image
What is
Problem solving is the ability to identify, analyze, and resolve challenges by applying logical thinking, creativity, and data-driven approaches to achieve effective solutions. In data analysis, this skill is fundamental because professionals constantly encounter complex questions, ambiguous datasets, and evolving business needs that require innovative and accurate resolutions.

Concept
Problem solving directly enhances a data analyst’s performance by enabling them to navigate obstacles, interpret unclear data, and deliver actionable insights even in uncertain situations. Clients and employers highly value this skill because it ensures that business questions are addressed efficiently and that data-driven decisions are both reliable and impactful. Cultivating problem solving involves practicing critical thinking, seeking feedback, engaging in diverse analytical projects, and staying updated with industry tools and methodologies. Over time, consistent exposure to varied challenges helps analysts refine their approach, build confidence, and develop a structured mindset for tackling new and unfamiliar problems.

Real World Example
Imagine a data analyst working for a retail company who is tasked with identifying the cause of a sudden drop in online sales. The available data is incomplete and scattered across multiple sources. By leveraging problem solving skills, the analyst systematically investigates potential issues, such as website errors, marketing campaign changes, or inventory shortages. Through careful data cleaning, hypothesis testing, and collaboration with other departments, the analyst uncovers that a recent website update inadvertently disrupted the checkout process. By presenting this finding and recommending a solution, the analyst not only resolves the immediate issue but also demonstrates the critical value of problem solving in driving business success.

Positives


Self Satisfaction

### Self Satisfaction Image
What is
Self satisfaction is the deep sense of fulfillment and contentment that arises from achieving personal goals, overcoming challenges, and making meaningful contributions through one’s work. In data analysis, self satisfaction stems from solving complex problems, uncovering valuable insights, and knowing that your efforts drive informed decisions and positive change within organizations.

Concept
Self satisfaction plays a pivotal role in making a career in data analysis truly rewarding. When professionals feel genuinely fulfilled by their work, they are more motivated to tackle challenging projects and continuously improve their skills. This intrinsic motivation leads to higher job satisfaction, greater resilience in the face of setbacks, and a stronger commitment to professional growth. Data analysts often witness the tangible impact of their analyses on business strategies and outcomes, which reinforces their sense of purpose and accomplishment. Experiencing self satisfaction daily not only enhances personal well-being but also fosters a positive work environment, encouraging collaboration and innovation within teams.

Real World Example
Imagine a data analyst working for a healthcare organization who is tasked with analyzing patient data to identify trends in treatment outcomes. After weeks of meticulous work, the analyst uncovers a pattern that leads to a new, more effective treatment protocol. The implementation of these findings results in improved patient recovery rates and reduced hospital stays. Witnessing the direct impact of their analysis on patient lives, the analyst feels a profound sense of self satisfaction. This fulfillment comes not just from professional recognition, but from knowing their expertise has contributed to real-world improvements, reinforcing their passion for the field and inspiring them to continue making a difference through data.

Monetary Potential

### Monetary Potential Image
What is
Monetary potential refers to the capacity for significant financial gain and upward earning mobility within a particular career. In data analysis, this means professionals can expect competitive salaries, bonuses, and opportunities for financial advancement as their expertise grows. This positive aspect encourages ambition, rewards skill development, and attracts talented individuals to the field.

Concept
The monetary potential in data analysis is a powerful motivator that enhances both job satisfaction and career growth. Knowing that their skills are highly valued and well-compensated, data analysts are inspired to continually improve and innovate. This financial recognition not only affirms their contributions but also provides a sense of security and stability. As organizations increasingly rely on data-driven decisions, the demand for skilled analysts continues to rise, further boosting earning opportunities. Professionals experience this benefit daily through competitive paychecks, performance bonuses, and the prospect of rapid advancement, all of which contribute to a fulfilling and motivating work environment.

Real World Example
Imagine a data analyst working at a fast-growing tech company. After leading a project that uncovers key insights driving a major increase in revenue, the analyst receives a substantial performance bonus and a salary raise. This recognition not only rewards their hard work but also demonstrates the tangible value of their expertise. The analyst feels a deep sense of accomplishment, knowing their skills directly impact both the company’s success and their own financial well-being. This experience reinforces their commitment to the profession, motivating them to pursue further learning and take on new challenges, confident that their efforts will continue to be financially and professionally rewarding.

Changing Your Thinking

### Changing Your Thinking Image
What is
"Changing Your Thinking" means embracing new perspectives, questioning assumptions, and adapting your mindset to interpret data in innovative ways. In data analysis, this approach fosters creativity, sharpens problem-solving skills, and encourages continuous learning. By shifting viewpoints, professionals uncover hidden patterns, generate fresh insights, and drive impactful decisions within organizations.

Concept
The ability to change your thinking is a cornerstone of success in data analysis, as it transforms routine tasks into intellectually stimulating challenges. This mindset nurtures curiosity and resilience, allowing analysts to approach complex problems with flexibility and confidence. As professionals encounter diverse datasets and evolving business questions, they learn to adapt their strategies, which leads to personal and professional growth. The satisfaction of discovering unexpected trends or solving intricate puzzles fuels motivation and engagement. Over time, this dynamic way of thinking not only enhances analytical skills but also opens doors to leadership opportunities and cross-functional collaboration, making each day in the field both rewarding and transformative.

Real World Example
Imagine a data analyst working for a retail company who is tasked with understanding a sudden drop in sales. Initially, the analyst assumes the cause is seasonal variation, but after re-examining the data with a fresh perspective, they notice subtle shifts in customer demographics and purchasing behavior. By changing their thinking and exploring alternative explanations, the analyst uncovers that a competitor’s new marketing campaign is attracting their core customers. This realization leads to actionable recommendations for targeted promotions and product adjustments. The experience is deeply fulfilling, as it demonstrates the power of adaptive thinking to solve real business challenges and make a tangible impact on the company’s success.

Challenges


Physically Demanding

### Physically Demanding Image
What is
In data analysis, "Physically Demanding" refers to the prolonged periods of sitting, screen time, and repetitive computer-based tasks that can lead to fatigue, eye strain, musculoskeletal discomfort, and reduced physical well-being. This challenge arises because data analysts often work long hours with minimal movement, making physical health a concern.

Concept
The physically demanding nature of data analysis can manifest as chronic back pain, eye fatigue, and general lethargy, all of which can diminish productivity and job satisfaction. This environment requires resilience, as professionals must maintain focus and accuracy despite physical discomfort. Successful data analysts address these challenges by integrating regular movement into their routines, optimizing their workstations for ergonomics, and practicing mindful breaks to reduce strain. They also recognize the importance of physical health in sustaining mental acuity, making conscious efforts to balance intense screen time with restorative activities. By proactively managing their physical well-being, they are better equipped to handle the demands of their role and maintain high performance over time.

Real World Example
Consider a data analyst working on a critical project with tight deadlines, requiring extended hours at their desk. Aware of the risks associated with prolonged sitting, they set reminders to stand and stretch every hour, use a sit-stand desk to alternate positions, and adjust their monitor to reduce eye strain. They also incorporate short walks during lunch breaks and practice simple exercises at their workstation. By prioritizing these habits, the analyst not only alleviates physical discomfort but also maintains focus and energy throughout the project. This proactive approach enables them to deliver high-quality work without compromising their health, demonstrating how mindful strategies can effectively counteract the physically demanding aspects of data analysis.

Too Much Focus

### Too Much Focus Image
What is
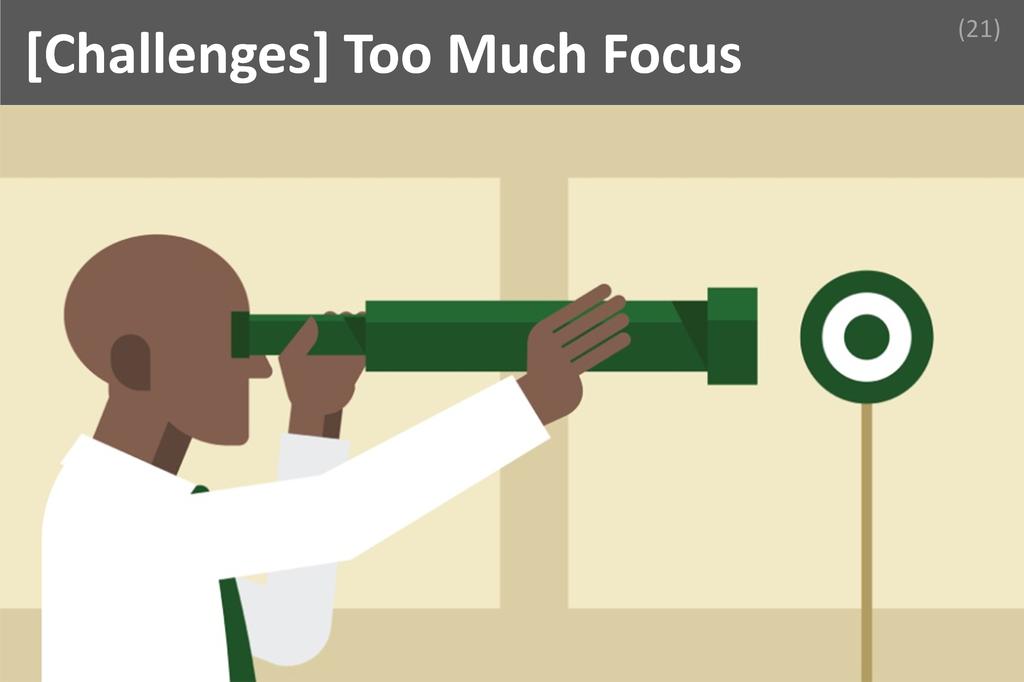
Too much focus in data analysis refers to the tendency to become overly absorbed in a single dataset, metric, or analytical approach, often at the expense of broader context or alternative perspectives. This intense concentration can limit creativity, hinder collaboration, and make it difficult to adapt to evolving project requirements or stakeholder needs.

Concept
The challenge of too much focus can lead to tunnel vision, causing analysts to overlook important variables, emerging trends, or potential errors in their work. This narrow approach may result in missed opportunities for innovation and can slow down project progress when unexpected issues arise. Resilience is essential, as professionals must recognize when their attention has become too restricted and consciously step back to reassess the bigger picture. Successful data analysts develop habits such as regularly consulting with colleagues, seeking feedback, and scheduling deliberate breaks to refresh their perspective. By cultivating self-awareness and maintaining open communication, they ensure their analyses remain robust, relevant, and adaptable to changing demands.

Real World Example
Consider a data analyst working on customer churn prediction for a subscription service. Initially, the analyst becomes deeply engrossed in optimizing a single machine learning model using only transactional data, ignoring other valuable sources like customer feedback or support interactions. Realizing the risk of too much focus, the analyst pauses to consult with the marketing and customer service teams, gaining new insights into customer behavior. By integrating these diverse data sources and perspectives, the analyst not only improves the model’s accuracy but also uncovers actionable strategies for customer retention. This shift from narrow concentration to a more holistic approach demonstrates how recognizing and addressing the challenge of too much focus can lead to more impactful and well-rounded analytical outcomes.

A Day Of


Data Analysis

What is
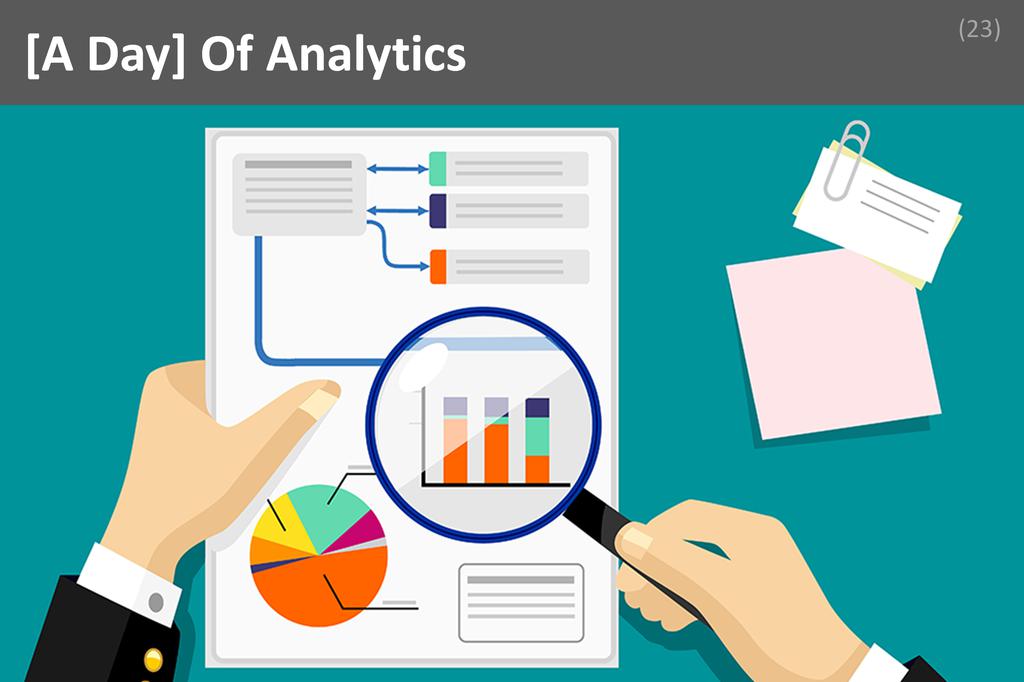
When the world is just beginning to stir, a data analyst’s day is already humming with anticipation. The pace is brisk, driven by the constant flow of information and the ever-present demand for insights that can shape business decisions. The environment is a blend of quiet concentration and collaborative energy, where the hum of computers and the soft clatter of keyboards signal the start of another day spent transforming raw data into actionable knowledge. Each hour brings a new challenge, whether it’s wrangling unruly datasets, uncovering trends, or translating complex findings into stories that drive strategy. In the world of data analysis, no two days are ever quite the same, but every day is defined by curiosity, precision, and the relentless pursuit of clarity.

Concept
As the sun rises, the data analyst settles in with a fresh cup of coffee, reviewing emails and checking the status of overnight data pipeline runs. This early hour is reserved for scanning dashboards, verifying that automated reports have executed correctly, and prioritizing the day’s tasks based on urgent requests or anomalies flagged by monitoring systems. It’s a time for quiet focus, ensuring that the foundation for the day’s work is solid and that any data quality issues are identified before deeper analysis begins.

Real World Example
By mid-morning, the analyst is fully immersed in the core work of the day: exploring datasets, running queries, and building models to answer pressing business questions. This is the most intense and intellectually demanding part of the day, requiring sharp analytical thinking and technical skill. Whether it’s segmenting customer behavior, forecasting sales trends, or troubleshooting unexpected results, the analyst navigates a maze of variables and hypotheses, often losing track of time as they chase down patterns and correlations that could unlock new opportunities for the organization.

The afternoon brings a shift from solitary analysis to collaborative execution. The analyst joins meetings with stakeholders, presenting findings and discussing the implications of recent analyses. This is when data comes to life, as complex results are distilled into clear narratives and actionable recommendations. Feedback from colleagues and business partners sparks new questions, and the analyst may need to adjust models or dig deeper into specific metrics. The energy is dynamic, as ideas are exchanged and decisions are shaped by the evidence at hand.

As the day winds down, the analyst turns to documentation, updating project notes and ensuring that code and reports are organized for future reference. There’s time for a final review of dashboards and a quick scan of industry news or new analytical techniques that might enhance tomorrow’s work. Before logging off, the analyst outlines priorities for the next day, setting the stage for another cycle of discovery and insight. The day ends as it began: with a commitment to clarity, accuracy, and the endless possibilities hidden within the data.


Install the LifePage App to:


  1. (for Free) Watch Senior Associate Sunaina Kuhn’s full Data Analysis Career Talk

  2. ₹ Do a Self Assessment on Data Analysis to calculate your Dream Index, which is defined as:

    According to Sunaina Kuhn your chances of success in Data Analysis is __%

  3. Access your personalized Dream Index Report which will have all your Dream Indices sorted in descending order.

Career Counselling 2.0


<?php echo $altimage; ?>


<?php echo $altimage; ?>


How to get into

Data Analysis?


If you are want to get into Data Analysis, start by investing in a Career Plan.

The 14 hour process, guided by a LifePage Career Advisor, will help you introspect and check whether your interest in Data Analysis is merely an infatuation or is it truly something you wish to do for the rest of your life.

Next, your Career Advisor will help you document how you can get into Data Analysis, what education and skills you need to succeed in Data Analysis, and what positives and challenges you will face in Data Analysis.

Finally, you will get a Career Plan stating which Courses, Certifications, Trainings and other Items you need to do in the next 7 years to become world’s best in Data Analysis.


LifePage Career Plan

14 hour personalized guidance program


Your LifePage Career Advisor facilitates your guided introspection so that you systematically explore various Career options to arrive at a well thought out Career choice.

Next: your Advisor helps you figure out how you will get into your chosen Career and how will you develop the skills needed for success in your Chosen Career.

LifePage Plan will not stop at saying "to become an Architect study Architecture". It will guide you on which Certifications, Trainings and Other items you need to do along with your Architecture education to become the world's best Architect.


Links for this Talk


Senior Associate Sunaina Kuhn's LifePage:


Career Counselling 2.0
[LifePage]
https://www.lifepage.in/page/sunainakuhn


Similar Talks


Career in Decision Management
Decision Management
Kapil Rawat
Business Analyst | G E Corp, Bangalore
[ 3 years & 2 months Experience ]

Use of computers allows organizations to collect enormous amount of data. Decision Management is tasked with analyzing this data to help take smarter business decisions. These decisions can comprise of anything and everything, like which advertisement to show to a particular user on Facebook or which credit card defaulters to call and when.

"After M A in Economics from JNU, I started my career as a Business Analyst with G E Corp in Bangalore. In my almost two years there I was responsible for making data based collections strategies for two large US retailers with several million defaulting buyers."


Career Counselling 2.0 Career Counselling 2.0 Career Counselling 2.0 Career Counselling 2.0 Career Counselling 2.0


Career in Actuarial Profession
Actuarial Profession
Romik Rai
Risk Officer | Ageas SA/NV
[ 9 years Experience ]

An Actuary is a business professional who deals with the measurement and management of risk and uncertainty. These risks can affect both sides of the balance sheet, and require asset management, liability management, and valuation skills. Actuaries use mathematics, statistics, and financial theory to study uncertain future events, especially those of concern to insurance and pension programs.

"After completing my Masters in Actuarial Studies from University of New South Wales, Australia, I started working as a consultant with Watson Wyatt Worldwide. I have worked with over 20 financial institutions across Europe and Asia. Currently, I am the Founder and CEO of Greenassets.in which I started in 2015 in India. Greenassets.in is a startup where we promote investments which have a positive environmental and social impact."


Career Counselling 2.0 Career Counselling 2.0 Career Counselling 2.0 Career Counselling 2.0 Career Counselling 2.0


Career in Planning & Statistics
Planning & Statistics
Dr Manoj Pant
Chief Coordination Officer | Department Of Planning
[ 25 years Experience ]

Statistics is a branch of mathematics dealing with the collection, analysis, interpretation, presentation, and organization of data. Statistics in indispensable into planning in the modern age which is termed as the age of planning. Almost all over the world the govt. are re-storing to planning for economic development.

"I completed my MSC in Statistics from Lucknow University. I did my PG Diploma in Computer Application. I joined Department of Planning as Chief Coordination Officer."


Career Counselling 2.0 Career Counselling 2.0 Career Counselling 2.0 Career Counselling 2.0 Career Counselling 2.0


Career in Data Science
Data Science
Rajan Gupta
Analytics Consultant | Various Assignments
[ 7 years & 4 months Experience ]

Data science is an interdisciplinary field that uses scientific methods, processes, algorithms and systems to extract knowledge and insights from data in various forms, both structured and unstructured, similar to data mining.

"I am a Research & Data Analytics professional, learning new ways to deal with various business and research problems through technological and analytical tools. With the help of past experiences and academic exposure, following are the highlights of current capabilities. I have a substantial experience of working on research & analytics projects in the area of Information Systems, E-Governance and Public Schemes Assessment. I have working knowledge of application of various data science concepts through statistical techniques, operation research & optimization, data mining and machine learning across multiple industries (healthcare, retail, education, etc.) and domains. I have hands-on experience of using various analytical & development tools like SPSS, R, Tableau/MS Power BI and MATLAB and exposure of training and teaching in specialized areas of IT & Analytics. I am UGC NET-JRF Qualified and also possess management consulting certification from Government of India. I am one of the few Analytics professional in India to have CAP (INFORMS) and GStat (ASA) certification & accreditation, respectively and also serving as the Brand Ambassador of CAP in Asia Region for INFORMS. I am Efficient in Report preparation and Article writing. I can prepare Research proposals, Research Frameworks, Data Source identification, Data Collection Framework and Data Preparations. I have experience of handling teams up to 50 people for project execution."


Career Counselling 2.0 Career Counselling 2.0 Career Counselling 2.0 Career Counselling 2.0 Career Counselling 2.0


Career in Risk Analytics
Risk Analytics
Malika Davar
Senior Consultant | BFSI Analytics
[ 5 years & 10 months Experience ]

Risk analytics (or risk analysis) is the study of the underlying uncertainty of a given course of action. It often works in tandem with forecasting professionals to minimize future negative unforseen effects.

"I pursued a Bachelors degree in Economics from St Stephen's College and a Masters degree in Economics from Delhi School of Economics. Soon after, I joined BFSI Risk Analytics where I have been working for more than 4 years. Currently, I am working there as a Senior Consultant."


Career Counselling 2.0 Career Counselling 2.0 Career Counselling 2.0 Career Counselling 2.0 Career Counselling 2.0


Career in Data Analytics
Data Analytics
Pratap Shankar Gharge
Executive President & CIO | Bajaj Electricals
[ 34 years & 2 months Experience ]

Data analytics or analysis is a process of inspecting, cleansing, transforming, and modeling data with the goal of discovering useful information, informing conclusions, and supporting decision-making

"After completing my graduation from Shivaji University, Diploma in Computer Management from Mumbai University and an MBA (Operations Research) from IGNOU, I started my career with Simplex Textile Mills as a Programmer (1984-85) and post that I was associated with Bajaj Electricals for 33 Years and retired as an Executive President & Chief Information Officer."


Career Counselling 2.0 Career Counselling 2.0 Career Counselling 2.0 Career Counselling 2.0 Career Counselling 2.0


Career in Data Sciences
Data Sciences
Dr T P Singh
Professor | UPES
[ 22 years & 4 months Experience ]

Data science is an interdisciplinary field that uses scientific methods, processes, algorithms and systems to extract knowledge and insights from data in various forms, both structured and unstructured, similar to data mining.

"After completing my education, I started my career with TCS as a DBA. After that, I joined Sharda University as an Associate Professor and worked there for almost 17 years. I am a Professor at UPES since 2017."


Career Counselling 2.0 Career Counselling 2.0 Career Counselling 2.0 Career Counselling 2.0 Career Counselling 2.0


Career in Data Science & Statistics
Data Science & Statistics
Raman Nautiyal
Scientist E | Indian Council of Forestry Research & Education (ICFRE)
[ 20 years & 10 months Experience ]

Data science is an interdisciplinary field that uses scientific methods, processes, algorithms and systems to extract knowledge and insights from data in various forms, both structured and unstructured, similar to data mining. Statistics is a branch of mathematics dealing with the collection, analysis, interpretation, presentation, and organization of data.

"I did Bachelors in Statistics, Maths & Economics from DAV College, Dehradun. I then did Masters in Statistics from the same college. I am pursuing my Ph D in Statistics from Kumaon University. I am a Scientist E at Indian Council of Forestry Research & Education (ICFRE)."


Career Counselling 2.0 Career Counselling 2.0 Career Counselling 2.0 Career Counselling 2.0 Career Counselling 2.0


Career in Data Science
Data Science
Aayushi Verma
Data Scientist | EdGE Networks Pvt Ltd
[ 5 years Experience ]

Data science is a multidisciplinary blend of data inference, algorithmm development, and technology in order to solve analytically complex problems. At the core is data. Troves of raw information keep streaming in and stored in enterprise data warehouses as there is much to learn by mining it.

"After completing my M Tech in Data Analytics, I joined a start-up in Delhi as a Data Scientist. After that I have worked for few companies as a Data Scientist, in 2018, I joined EdGE Networks Pvt Ltd as Data Scientist. I have also published few Research Papers in Journals like IEEE & Springer."


Career Counselling 2.0 Career Counselling 2.0 Career Counselling 2.0 Career Counselling 2.0 Career Counselling 2.0


Career in Economics & Finance Consulting
Economics & Finance Consulting
Manmeet
Consultant | Planning Commission of India
[ 7 years Experience ]

Economic consulting is the practice of providing organizations in the public and private sector with information to improve their performance and policies, primarily through the use of applied economics, mathematical economics, economic impact analysis, and forecasting across a broad spectrum of issues.

"After graduating in commerce, I went on to do masters in Economics. I also attended winter school in Delhi School of Economics. I have done a course in management from London School of Economics. I did my internship at Planning Commission of India. I have worked at RMS as Business Risk Analyst and as Risk Management Consultant at Inductis. I am Strategy & Operations Head at Nuts for Cuts."


Career Counselling 2.0 Career Counselling 2.0 Career Counselling 2.0 Career Counselling 2.0 Career Counselling 2.0


Career in Research in Data Science
Research in Data Science
Aayushi Verma
Data Scientist | EdGE Networks Pvt Ltd
[ 5 years Experience ]

Research in Data Science, which is a profession, the goal of Data Science research is to build systems and algorithms to extract knowledge, find patterns, generate insights and predictions from diverse data for various applications and visualization.

"After completing my M Tech in Data Analytics, I joined a start-up in Delhi as a Data Scientist. After that I have worked for few companies as a Data Scientist, in 2018, I joined EdGE Networks Pvt Ltd as Data Scientist. I have also published few Research Papers in Journals like IEEE & Springer."


Career Counselling 2.0 Career Counselling 2.0 Career Counselling 2.0 Career Counselling 2.0 Career Counselling 2.0


Career in Risk Analytics
Risk Analytics
Shobit Kumar Singhal
Assistant Manager | Barclays
[ 2 years Experience ]

Risk analysis is the process of identifying and analyzing potential issues that could negatively impact key business initiatives or critical projects in order to help organizations avoid or mitigate those risks.

"After completing my education, I joined Barclays as senior analyst and I am working as an Assistant Manager at Barclays."


Career Counselling 2.0 Career Counselling 2.0 Career Counselling 2.0 Career Counselling 2.0 Career Counselling 2.0


[Install the LifePage App to access all Talks]


<?php echo $altimage; ?>


<?php echo $altimage; ?>


&mbsp;


Career Counselling 2.0 | Home   Home  
Career Counselling 2.0 | Abroad   Abroad  
Career Counselling 2.0 | Plan   Plan  
Career Counselling 2.0 | Talks   Talks  
Career Counselling 2.0 | Philosophy   Philosophy  
Career Counselling 2.0 | Seminar   Seminar  
Career Counselling 2.0 | Workshop   Workshop  
Career Counselling 2.0 | Pages   Pages  
Career Counselling 2.0 | Advisors   Advisors  
Career Counselling 2.0 | Discuss   Discuss  
Career Counselling 2.0 | Meet   Meet  
Career Counselling 2.0 | Advisor   Advisor  
Career Counselling 2.0 | Story   Story  
Career Counselling 2.0 | Fine Print   Fine Print  
Career Counselling 2.0 | Links   Links  
Career Counselling 2.0 | Blog   Blog  
Career Counselling 2.0 | Testimonials   Testimonials  
Career Counselling 2.0 | Follow   Follow  
 
[ Site Visits ]


Career Counselling 2.0